Weekly Energy Industry Summary
Commodity Fundamentals
Week of April 8, 2024
By The Numbers:
- NG '24 prompt-month NYMEX settled at $1.84/MMbtu, up $.06/MMbtu, on Monday, April 8.
- WTI '24 prompt-month crude oil settled at $86.43/bbl., down $.48/bbl., on Monday, April 8.
Natural Gas Fundamentals - Neutral
- April is a low demand month when it comes to natural gas. In gas-industry terms, it is noted as a "shoulder month;" a time when there is little thermal demand in the residential and commercial sector and low air conditioning load relative to gas-fired power generation.
- Natural gas production continues to edge downward at 97.7 Bcf per day on Tuesday, April 9.
- Natural gas production averaged 100.1 Bcf per day for April, down 1.2 Bcf per day month-over-month and down 1.4 Bcf per day year-over-year.
- The U.S. oil and gas rig count is at 621 units, down from 758 one year ago.
- Despite producer cutbacks, natural gas storage inventories are 39% higher than the five-year-average, keeping prices in check.
- The gas bulls are waiting for the cavalry -- the cavalry is summer heat -- summer heat means air-conditioning -- air conditioning means rising demand for gas-fired electric power. If the cavalry does not arrive, gas prices are likely to stay lower for longer.
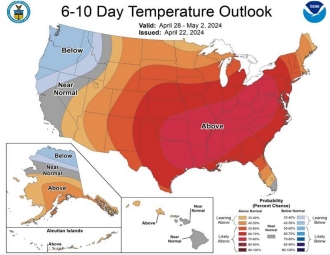
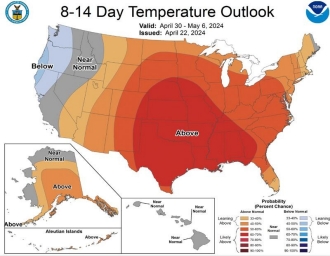
- Buyers should keep their eyes on the summer forecasts, which are coming in hot, particularly in the I-95 corridor, a key population and power-generation load region.

Crude Oil - Bullish
- WTI settled at $86.43 per barrel on Monday, April 8, down $.48 per barrel.
- Tensions are running high in the Middle East.
- Iran is threatening Israel with retaliation pursuant to an Israeli strike on the Iranian consulate in Syria.
- The potential for a broader war in the middle east is rising.
- The bullish sentiment in crude oil is also apparent in some other commodities -- gold posted an all-time-high of $2351 per ounce, silver prices are rallying ($27.81 per ounce, up $.30) and copper prices are up substantially.
- Mexico announced a round of crude oil export cuts, saying it will curtail 330,000 bbls/day, representing about one third of what it sells abroad.

Economy - Neutral
- Employment rose by 303,000 jobs in March, according to the Labor Department.
- Growth in hourly earnings slowed year-over-year 4.1% in March, the slowest since June of 2021.
- Small business optimism hit an 11-month low as inflation fears won't go away, CNBC reports.
- The Federal Government racked up a $1.1 trillion dollar deficit in the first six months of this year, the Congressional Budget Office reports.
- The U.S. is projected to spend $870 billion this fiscal year in interest to serve the ballooning debt -- more than it spends on the military.
- The Conference Board reports declining consumer confidence.
- The U.S. economy is a "tale of two cities." On the one hand, the labor market is chugging along, and inflation is declining (albeit from very high levels) -- on the other hand, profligate federal spending, rising deficits, rising interest payments on that debt and a much higher price level are keeping the mood quite sour.

Weather - Neutral
- After a colder-than-normal week throughout much of the Midwest and East, temperatures generally move to seasonal or slightly-above seasonal levels by the end of the week.
- Summer forecasts are coming in pretty hot.
- Constellation's weather desk has put forth a preliminary forecast placing this summer as a top five warmest since 1950.

Weekly Natural Gas Report:
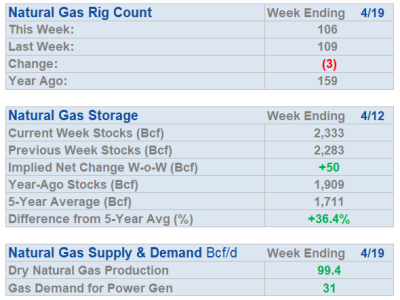
- Inventories of natural gas in underground storage for the week ending March 22, 2024 are 2,259 Bcf; a withdrawal of 37 Bcf was reported for the week ending March 29, 2024.
- Gas inventories are 633 Bcf greater than the five-year average and 422 Bcf greater than the same time last year.


Weekly Power Report:
Mid-Atlantic Electric Summary

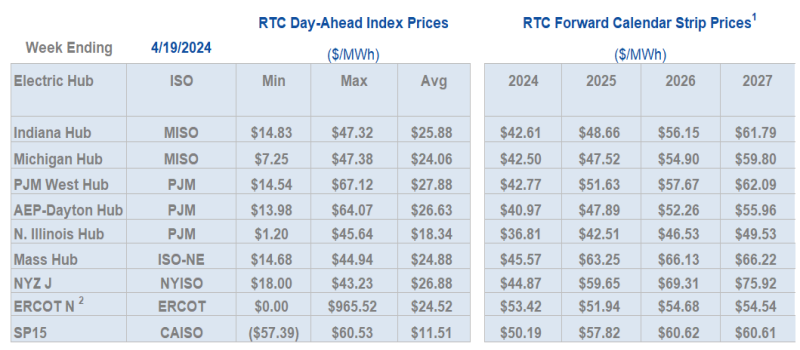
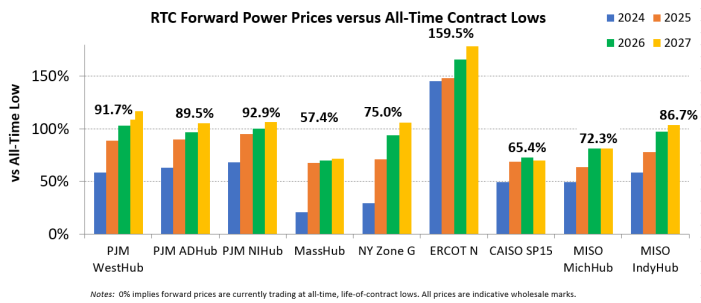
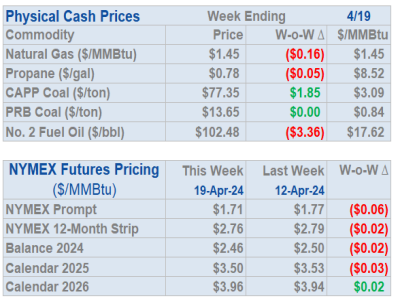
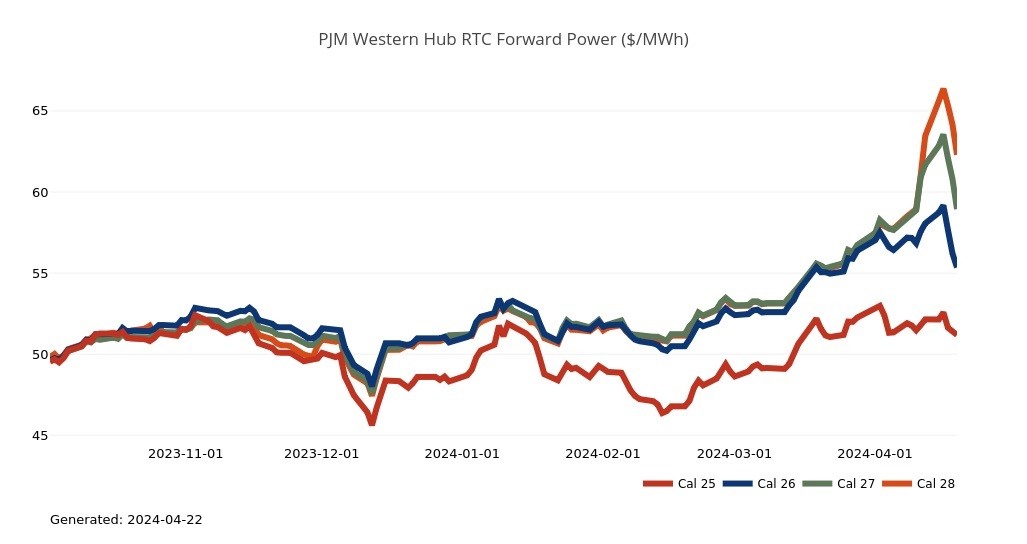
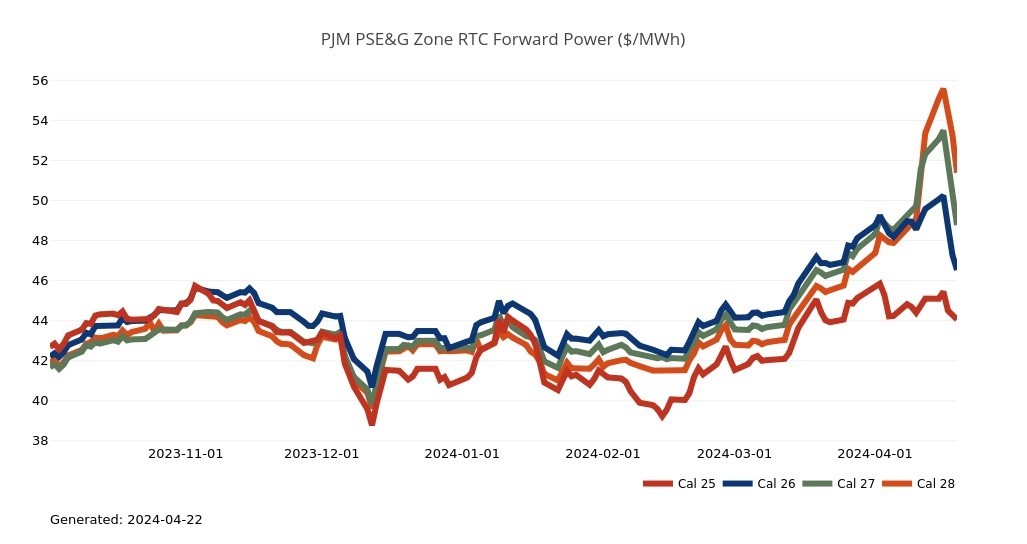
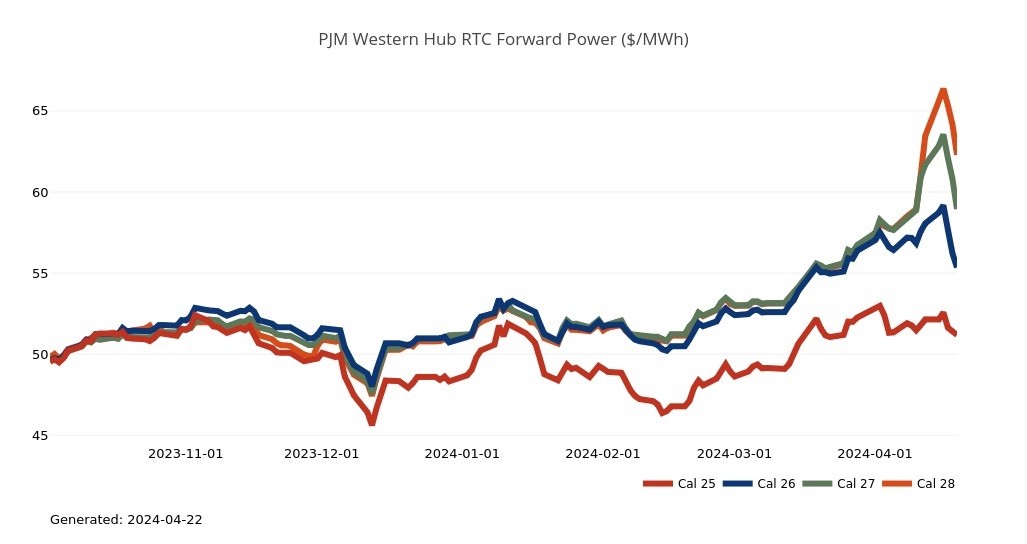
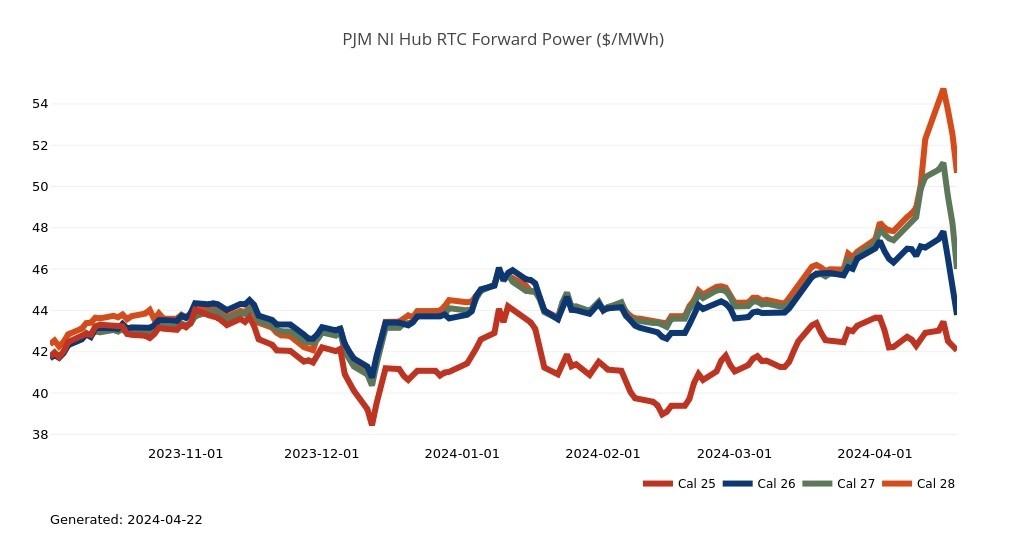
- The Mid-Atlantic Region’s forward power prices continue to press upwards. NYMEX is still held at bay below $2.00/MMBtu as the market is digesting rig cuts and a significant drop in natural gas production (projected April average of ~ 99 Bcf/d) with lower shoulder season (Spring) demand. Production is ~5-6 Bcf/d lower than where it was only a couple of months ago. Power forward prices continue to progressively move upward (+8%) over the past month, while the week-over-week gains (+2%-3%) are mostly on the back-end of the power curve for the 2026-2028 terms. Heat rates have expanded in most of the markets due to the contraction of gas prices and the increases of power forward pricing. We start off with a broadly mild weather pattern across the eastern and southern United States this week, but the forecasts cool in the East and South later this week. The month-to-date, day-ahead average settlement price for April in West Hub is $28.63/MWh, which is +20% higher than March’s settlement price average, but -47% lower than a year ago.
- PJM Posts Indicative Results for 2024/25 DPL-S Capacity Prices - Following the 3/12 Third Circuit Court of Appeals ruling to vacate the FERC orders allowing PJM to change capacity market rules for Delivery Year 2024/25, PJM filed a petition on 3/29 with FERC requesting an order by 5/6 confirming the applicable Tariff provisions governing the conduct of the Base Residual Auction (BRA) for the 2024/2025 Delivery Year are those in effect prior to the FERC Orders in this proceeding. PJM further requested, to the extent FERC makes such confirmation, that it authorize PJM to re-run the Third Incremental Auction for the 2024/2025 Delivery Year. PJM released indicative results for the 2024/25 BRA with the original planning parameters on 4/4. The Resource Clearing Price for DPL-S increased from $90.64/MW-day to $426.17/MW-day due to an increase in the reliability requirement of 361 MWs. Resource Clearing Prices for three other LDAs (PS, EMAAC, and PSNORTH) decreased by $1.35/MW-day. The results for other LDAs did not change. PJM includes a disclaimer with the posting that the information may change and “is not intended to be a substitute for the final auction results that may be updated and posted upon FERC directive.”
Great Lakes Electric Summary
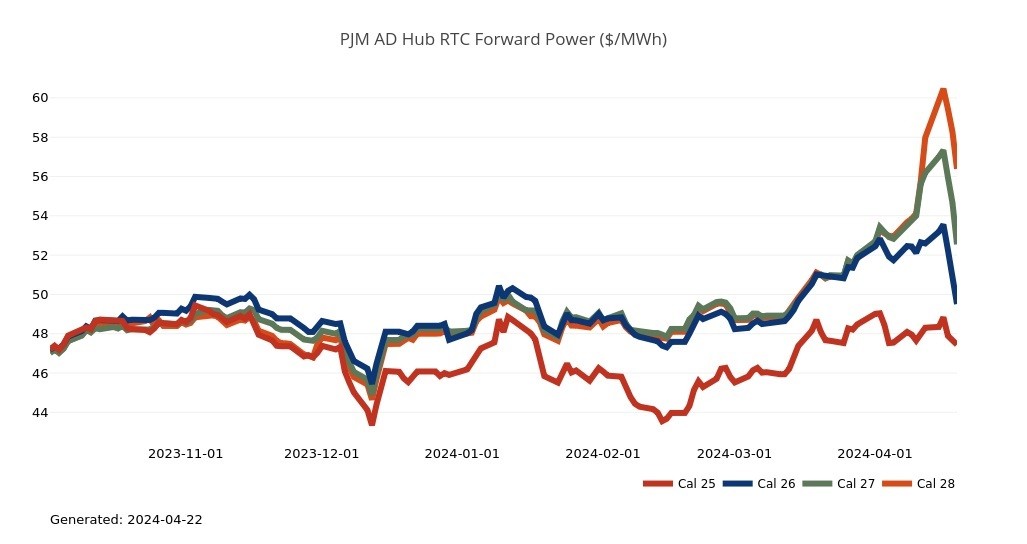
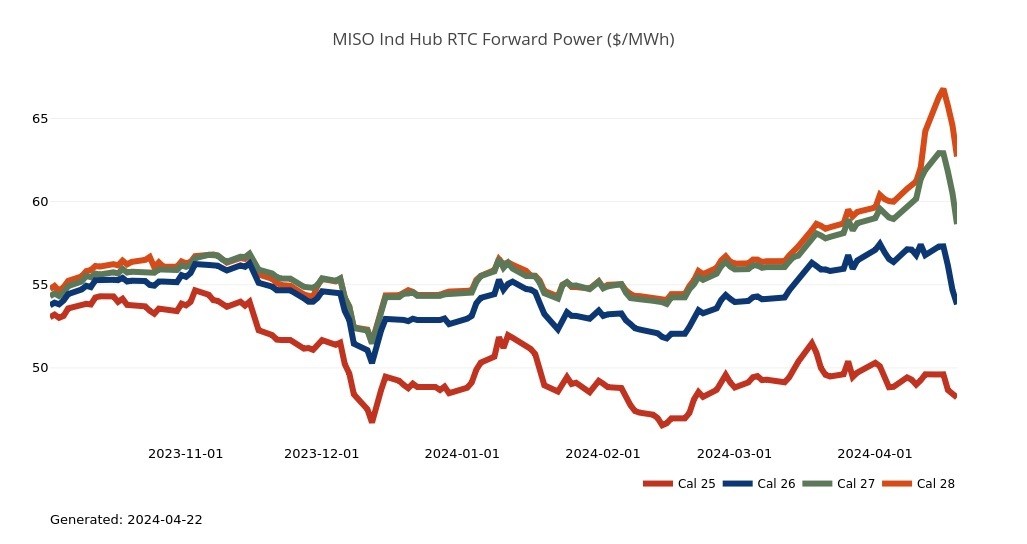
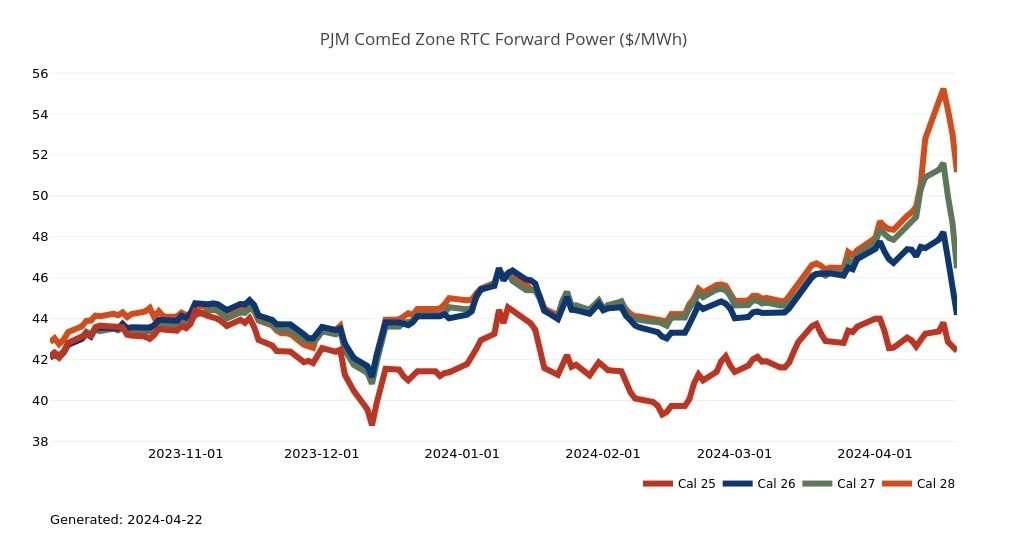
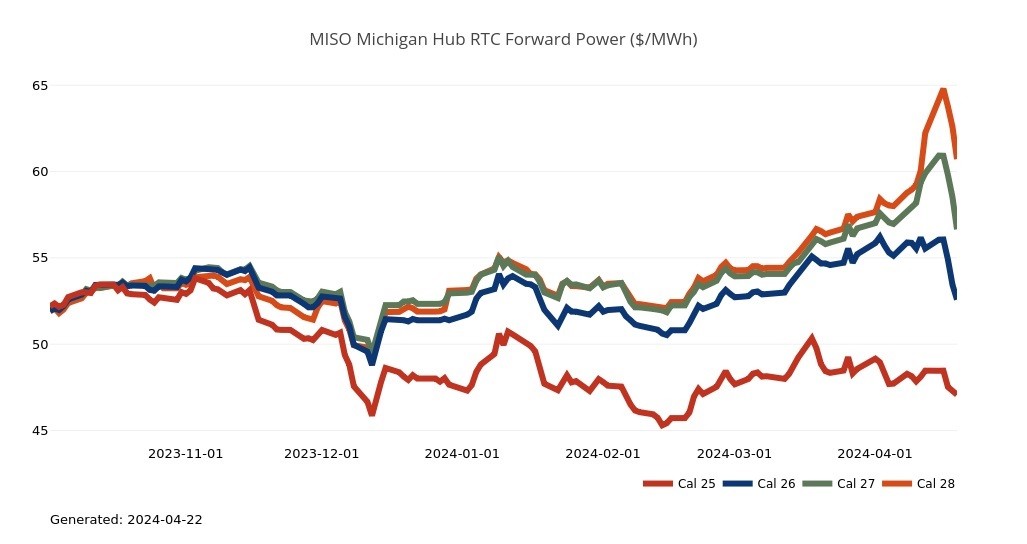
- The Great Lakes Region’s forward power prices continue to press upwards. NYMEX is still held at bay below $2.00/MMBtu as the market is digesting rig cuts and a significant drop in natural gas production (projected April average of ~ 99 Bcf/d) with lower shoulder season (Spring) demand. Production is ~5-6 Bcf/d lower than where it was only a couple of months ago. Power forward prices continue to progressively move upward (+6%) over the past month, while the week-over-week gains (+2%) are mostly on the back-end of the power curve for the 2026-2028 terms. Heat rates have expanded in most of the markets due to the contraction of gas prices and the increases of power forward pricing. We start off with a broadly mild pattern across the eastern and Southern United States this week, but cool air coming in from the north and west will trigger severe thunderstorms in the southern Plains. The April month-to-date, day-ahead average settlement price in Adhub is currently $25.16/MWh or +14% higher than last month, as well as -47% lower than last year at this time, while in COMED, that index price is $19.11/MWh or +16% higher month-over-month, as well as -41% lower than last year. In Michigan, the month-to-date, day-ahead average settlement price is currently $25.93/MWh or +16% higher month-over-month, as well as -12% lower than last year , while in Ameren, that index price is $24.80/MWh thus far or +18% higher than last month, as well as -1% lower than last year.
- MISO Files Revised Capacity Accreditation Method - On 3/28, MISO filed revisions to its capacity accreditation methodology that, if approved, will take effect for the 28/29 planning year. The changes are intended to address the risks associated with the changing resource mix while maintaining reliability and sending appropriate price signals. MISO proposes to transition to a two-step resource accreditation method known as the direct loss of load (DLOL) methodology. The proposed method measures a resources’ availability when reliability risk is the greatest based on both prospective and retrospective risk assessments. MISO’s proposed DLOL-based methodology first measures a resource’s expected marginal contribution to reliability using resource class-level performance during the loss of load expectation (LOLE) analysis. The LOLE analysis includes a Monte Carlo probabilistic simulation using 30 years of correlated load and weather data for each of five load forecasts that incorporates economic uncertainties and associated probabilities into the forecasts (probabilistic approach). The second step in the DLOL-based methodology then uses historical resource-level performance (deterministic approach) under MISO’s Tariff to accredit individual resources within their respective Resource Class. The DLOL-based methodology balances a range of reliability risks in the planning and operations horizons by incorporating forward-looking probabilistic analysis and measuring a resource’s actual performance during recent periods of high system risk. Under the proposal, MISO defines the periods of highest system risk identified in the probabilistic analysis as “Critical Hours”. Critical Hours include all loss of load hours and may also include low margin hours comprised of those hours where available generation in excess of load is less than or equal to 3% of load.
Northeast Energy Summary
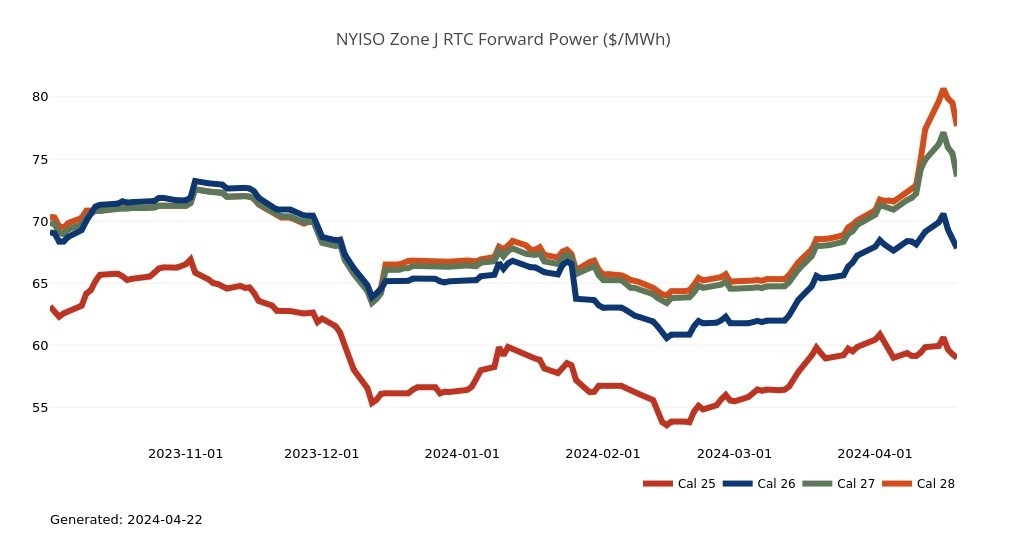
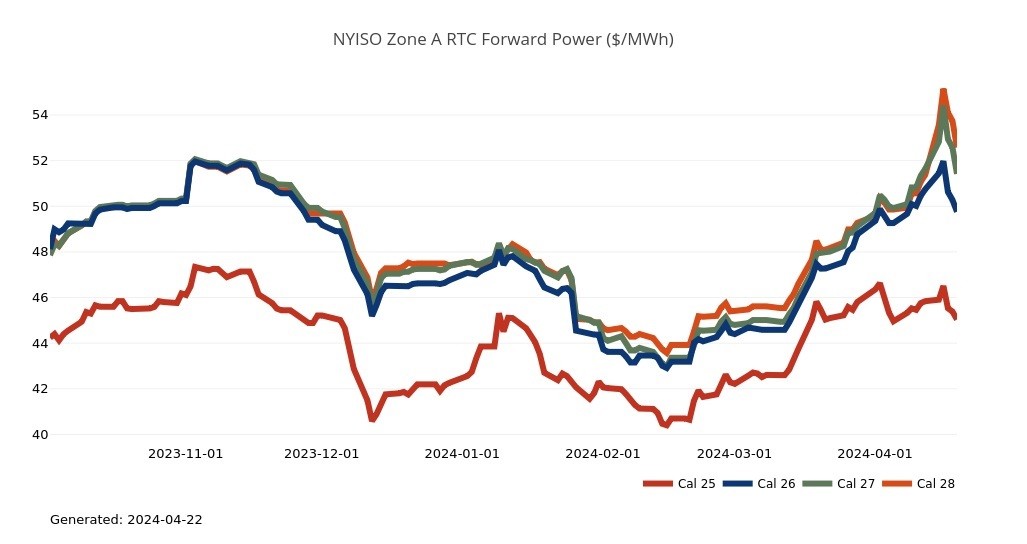
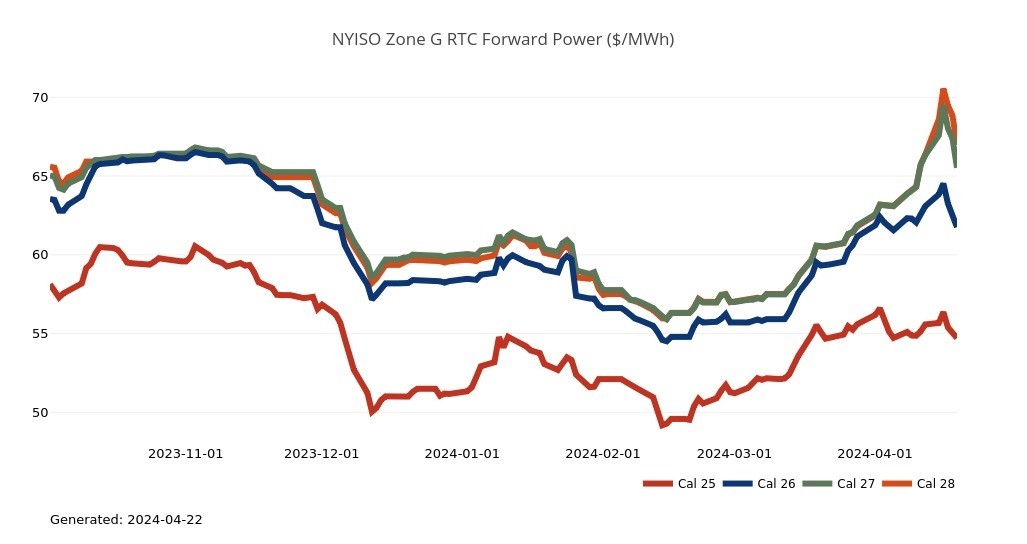
- New York’s forward power prices are mixed this week. The front of the price curve (2024-2025) seems to be more influenced by bearish natural gas fundamentals while the back of the curve (2026-2028) seems to be more influenced by the states shifting generation landscape. Meeting the states Climate Leadership and Community Protection Act (CLCPA) goals requires generation investment considering expected fossil fuel retirements, especially given expectations for industrial load growth tied to several large load interconnections anticipated in western and central New York in coming years. Statewide, Bal ’24 and Cal ’25 were flat week over week, but Cal ’26- Cal ’28 moved higher by about 3-4% depending on zone. That said, power forwards in several New York zones are down significantly from a year ago. Cal’ 25 is nearly 20% lower than last year in Zone F, and nearly 15% lower than last year in zones G – J. Upstate, Cal ’25 has moved up slightly since last year, anywhere form 3 – 6% depending on zone. Spot prices fell across zones month over month, as warmer Spring temperatures reduced power and heating demand in March.
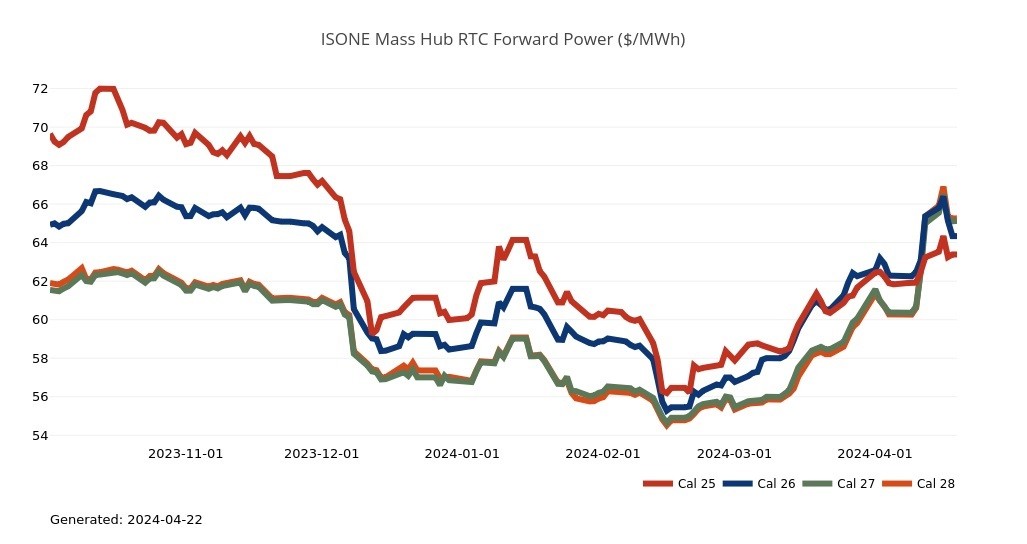
- On April 4, the NEPOOL Participants Committee (PC) voted in favor of ISO-NE’s proposal to delay Forward Capacity Auction 19 (power year June 2028 - May 2029) by two additional years beyond the current schedule. FCA 19 had been planned to run in February 2026, following a one-year delay approved by FERC to complete the Resource Capacity Accreditation (RCA) design. ISO-NE is proposing the additional delay to allow time to develop and vet through NEPOOL its proposal to convert the capacity market to a prompt/seasonal design beginning in FCA 19, along with implementation of the RCA. ISO-NE characterized the two-year delay in FCA 19 as a “backstop” in the event that FERC does not accept ISO-NE’s eventual filing of the prompt/seasonal design or ISO-NE does not complete the design changes in time for effect in FCA 19. While stressing the need to implement RCA reforms together with a prompt-seasonal market for the 2028/29 auction, ISO-NE is concerned that a substantial capacity market redesign filing may be challenging for FERC to review. To that end, ISO-NE is considering a phased filing approach under which some aspects would be filed first, including the prompt design and the retirement process. In its FERC filing, ISO-NE will emphasize that its current request is only for a delay to the auction and not for ultimate approval of the move away from a forward-annual capacity market design. ISO-NE’s filing letter also will flag stakeholder concerns over the transition back to a forward-annual construct should a prompt-seasonal design not be implemented and note FERC’s ability to require a revised transition if needed. ISO-NE filed the tariff changes at FERC on April 5 requesting expedited treatment and a FERC order in 45 days (May 20). ISO-NE will also request a shortened comment period of 15 days.
- On March 27, Granite Shore Power (GSP) announced that it would be closing its Merrimack and Schiller Stations, the last two coal-fired power plants in New England. These plants have been used as peaking resources during the hottest days of summer and coldest nights in winter. In 2019, the Sierra Club and the Conservation Law Foundation sued GSP over alleged violations of the Clean Water Act, leading to a settlement agreement between the parties and the Environmental Protection Agency (EPA) that included closure of the plants. Schiller Station will close by 12/31/25 and will be replaced by a renewable battery storage facility. Merrimack Station will close by 6/1/28 and will be converted to several renewable projects, including solar, battery storage, and potentially a hydrogen facility.
ERCOT Energy Summary



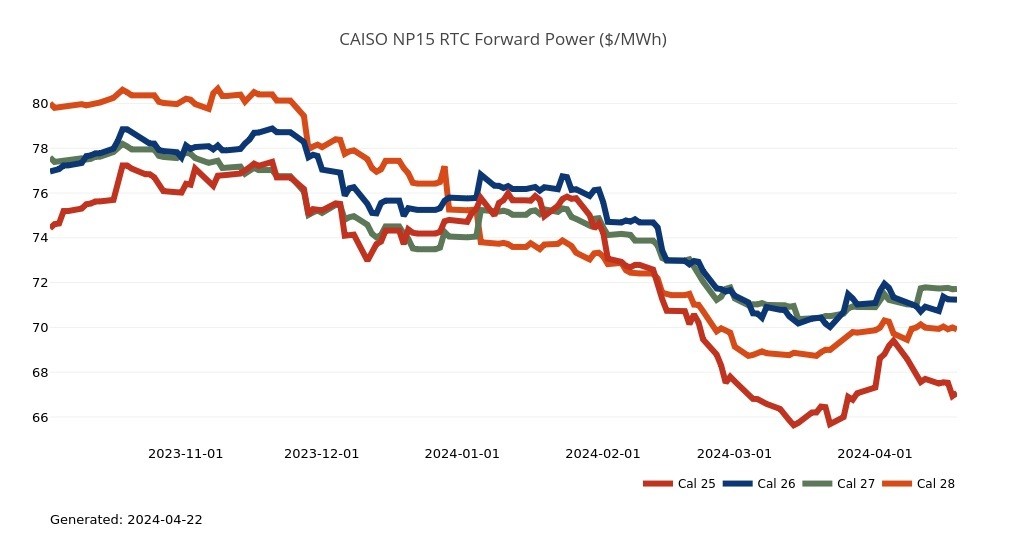
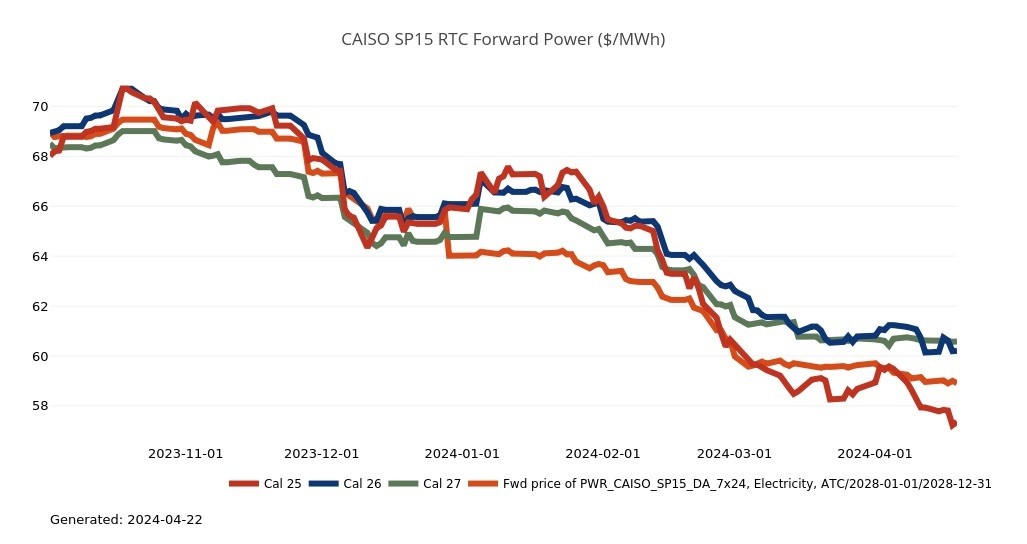
CAISO, Desert Southwest and Pacific Northwest Energy Summary
- This weekend was the last hurrah for winter weather across the West (we acknowledge we’ve said this before and been disappointed). The entire region west of the Rockies is going to flip from below back to above normal. The average temperatures in California are slated to rise 10-15 degrees above normal by the Thursday and whacking gas demand and power loads back to seasonal lows. Peak heat should come on Thursday with daytime highs expected to make it into the low-80s in LA Basin and the mid-90s in the DSW before turning milder for the weekend. Looking ahead towards next week, the pattern looks like it may feature near to below normal temperatures across the West before above-normals would settle over California and the DSW cities for the back half of the week, although not to the levels we will see this week. Neither SoCalGas or PG&E have had to call operational flow orders (OFOs) during this latest (and hopefully last) cold spell but as the region transitions back to injections look for high inventory issues to arise once again.
- The state survived its tiny share of the total solar eclipse without incident. As far as power goes anyway. But the sun returns uninterrupted today as the skies clear and the daylight hours stretch a couple minutes each day. Add in the snow melt that will be coming into play over the next few weeks as the temperatures warm and you can begin to picture the challenge grid operators face given the already steeply negative prices occurring in the CAISO, especially SoCal. Each day over the last week has seen most of the daytime hours clear below the $0 per MWh waterline with the worst so far having occurred this past weekend as the entire day ahead peak hour block settled both days around -$25 MWh with some hours in the real time settling below -$80 MWh. This is a benefit falling uniquely on buyers in SP15 as the instate lines are maxed out moving energy S to N preventing load in NP15 from fully sharing in the fun, while maintenance on the DC intertie continues to limit how much of the surplus can be pushed into the PNW. All the water on the grid is allowing dam operators to offer some impressive “flex” ability to the grid in terms of how they shape the generation to offset the solar profile – the generation profile over the weekend dropped to about 250 MWs during the middle of the day and then jumped up over 4000 MW for the evening ramp. This flex is impressive and the highest we have seen within the CAISO hydro system. Currently, the west grid has two nuclear units offline for refueling (Diablo Canyon 2 and Palo Verde 3). The loss of this generation will help support the day ahead settlement prices … but if the index price of -$2.49 MWh for flow today (Tuesday 4/9) is any indication, it’s not enough to offset the influx of solar on the grid midday.
- A fully paid-up power subscriber asked what causes OFOs and what they do to the gas grid, so we’ll take a few minutes here to explain. Pipelines and local distribution companies (LDCs) can issue operational alerts and OFOs for all sorts of reasons: ruptures, pigging (nope, not a typo; search on pipeline pigging to learn more) operations and other maintenance, compressor outages, wellhead freeze-offs, and other situations. They can also be issued if the pipeline does not have enough gas and pressures have dropped close to operational minimums, or the pipeline has too much gas and pressures are reaching operational maximums. OFOs are based on preserving the operational integrity of pipelines. When delving into the details of OFOs, it’s important to note that shippers of natural gas must keep a pipeline’s deliveries and receipts roughly matched, or balanced, with daily limits varying greatly depending on the pipeline, but numbers between 25% on the high side and 10% on the low side are typical. Said differently, with a 10% limit on a shipper’s deliveries from the pipeline, they must equal 90% - 110% of its receipts. When a pipeline has more gas going in than coming out (like PG&E most days so far this month), the pipeline’s operating pressure increases. When the pressure starts to approach maximum safe operating limits, PG&E must take immediate action to lower pressures. Enter the OFO. When pressures within the pipe near the redline, the operator would issue an OFO, first restricting the permitted variance between scheduled receipts and deliveries, then, if necessary, restricting any difference between scheduled and physical receipts and deliveries. If the entity injecting the gas fails to comply with the OFO and reduce their inputs, the pipeline can charge a penalty —essentially charging for their costs of disposing of the excess gas to reduce pressure on the line. In certain circumstances, these penalties can be huge, often multiples of the spot price at the time. All OFOs are not created equal. Most pipeline tariffs incorporate the concept of stages and tolerance bands. For example, PG&E’s tariff is graduated for five OFO stages. The tolerance bands (how far the injector can be out of balance) range from 25% down to 5% as the situation progresses from a Stage 1 to a Stage 5 event. PG&E’s non-compliance charges are $0.25 per dekatherm for Stage 1, $5.00 per dec for a Stage 3 (most common), increasing to a massive $25.00 per dec plus the Daily City Gate Index during a Stage 5 event. The bottom-line w/ an OFO is to change behaviors on both the supply and demand side of the pipe in order to bring pressure back into balance, and to make you regret your decision when your bill arrives if you did not play along.
Stay up-to-date on the latest energy news and information:
- Energy Market Intel Webinar - Register for our next market update webinar on Wednesday, May 8 at 2 p.m. ET when the CMG team will provide insights on market factors currently affecting energy prices, such as weather, gas storage and production, and domestic and global economic conditions.
- Fortunato & Friends Webcast - Stay tuned for more information on our next Fortunato & Friends webcast featuring Constellation's Chief Economist, Ed Fortunato and special guest to be announced soon!
- Energy Terms to Know - Learn important power, gas and weather terms.
- Sustainability Assessment - We invite you to complete a brief assessment that helps us learn where your company is in building and/or implementing a sustainability plan. Through these insights, Constellation can customize solutions to meet your needs.
- Subscription Center - Sign up to receive updates on the latest market trends.
Questions? Please reach out to our Commodities Management Group at CMG@constellation.com.


